Why did my FCI take a long time to failover?
Introduction
In this lab, you will find why the SQL Server AlwaysOn Failover Clustering Instance (FCI) is taking a long time to failover. The goal is to try and identify the cause and fix the issue.
Objectives
At the end of this lab, you will be able to:
- Understand the cause of long failover time and
- Fix the issue.
Estimated Time
45 minutes
Logon Information
Use the following credentials to login into virtual environment
- Username: corpnet\cluadmin
- Password: Pa$$w0rd
Before starting the training module, we recommend that you launch the labs and give them some time to stabilize. Please be aware that sometimes the AG may be in a resolving state and AG Replicas may be in a disconnected state. This is a platform issue and should stabilize after a few minutes
Environment review
Before you begin with the first exercise in the lab, let's review the lab environment.
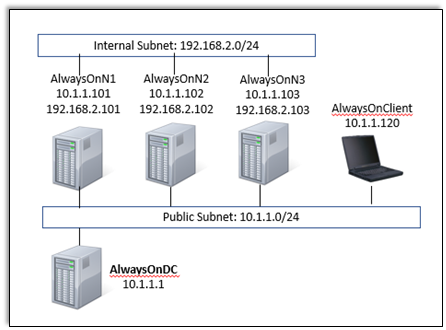
In the lab, you have one Domain Controller and 3 nodes + 1 client computer.
AlwaysOnN1 and AlwaysOnN2 nodes are in the primary Datacenter.
AlwaysOnN3 is in the secondary datacenter.
For this lab, both the datacenters are in the same subnet.
Each node has Windows Server 2022 O/S installed.
SQL Server 2022 failover clustered named instance (SQLFCI\INST1) is installed on AlwaysOnN1 and AlwaysOnN2 nodes.

Exercise 1: Identify why SQL FCI is taking a long time to failover and fix the issue
In this exercise, you will learn why SQL FCI is taking a long time to failover and fix the issue.
Tasks
Log on AlwaysOnClient VM and open Failover Cluster Manager (FCM).
Note down the cluster node where SQL Server (INST1) is currently running on (Let's say as an example it is running on AlwaysOnN2 node).
Connect to the SQLFCI\INST1 using SQL Server Management Studio.
Open a Query Window and execute the below command
SQLUSE ProdDBFrom FCM, manually failover SQL Server (INST1) to another node. (If SQL Server was running on AlwaysOnN2 node then manually failover to AlwaysOnN1 node and vice-versa.)
Observe the status of the SQL Server (INST1) resource. As soon as it becomes Online, execute the command in step 4 again
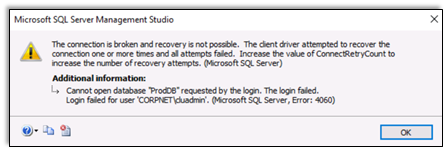
SQLUSE ProdDBYou may get one of the below errors


It is possible that you do not get any error as it is purely a timing issue.
Try again after a minute or two and you should be able to run the command successfully.

Find why the failover took a long time using the guidelines and cheat sheet provided below.
How much time did the actual failover (including accessing databases) take?
Once you find the cause, fix it and do a failover to check if it is faster.
What can you do to prevent this unexpected failover in the future?
Find the root cause using the guidelines and cheat sheet provided below.
Guidelines
This is a non-guided activity and the attendees are expected to try and troubleshoot the issue on their own.
You can use any resources (including the internet or your own scripts), to troubleshoot the issue.
You can use the tools discussed in the first module to help troubleshoot the issue.
The possible causes discussed earlier in the lesson can be used as guidance for troubleshooting.
The instructor will discuss the troubleshooting steps, cause and solution in detail after this lab session.
You might have to login directly on the individual nodes to troubleshoot the issue.
Ask yourself the below questions:
- Where do you start?
- What logs will provide me additional insights?
- What tools can I use to troubleshoot this issue?
- Could one or more of the possible causes discussed earlier be the issue here?
Cheat Sheet
Here are some tools that you use to troubleshoot the issue.
- Failover Cluster Manager
- SQL Server Management Studio
- Windows Event Viewer
Below are some logs that you may want to analyze
- SQL Server Error Logs
- Windows Application and System Log
- Windows Cluster Log
- SQL Server Cluster Diagnostics log (stored in the same folder as the SQL Server Errorlogs) – (Node Name)_(Instance Name)_DIAG*.xel
To determine the number of virtual log files (VLFs) in a database, execute the below TSQL command
SQLDBCC LOGINFO ('DB_NAME');- Replace DB_Name by the actual database name
- Number of VLFs = Number of rows returned by the above command
To generate and collect the cluster logs of all nodes in the cluster:
Run PowerShell as administrator and run the below commands
PowerShellImport-Module FailoverClusters
Get-ClusterLog
Default command Get-ClusterLog generates cluster.log file on ALL nodes in C:\Windows\Cluster\Reports folder.
All messages are logged using UTC/GMT time. Sometimes it's difficult to translate UTC time to local time, especially for time-zones which has daylight saving. Luckily, cluster log can be generated in local time using parameter UseLocalTime. Here is the sample code.
PowerShellGet-ClusterLog –UseLocalTimeAnother useful parameter is to copy the files to specific location. This command would generate logs and also dump on specified location. in below example, I am dumping logs from all nodes to C:\Temp folder.
PowerShellGet-ClusterLog –Destination "C:\Temp"
Congratulations!
You have successfully completed this exercise. Click Next to advance to the next lab.